April 17, 2006
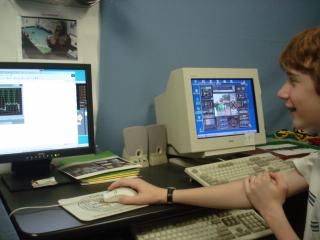
I have help running through the steps to run SENSORSCITY for data logging.

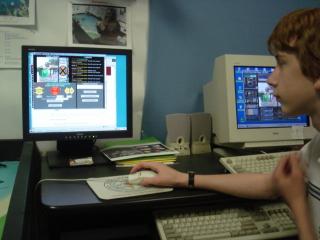
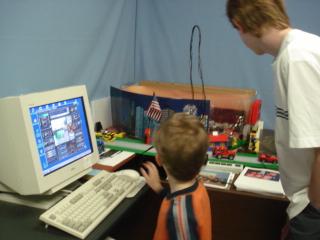
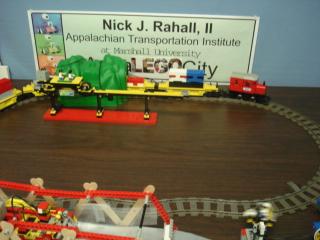
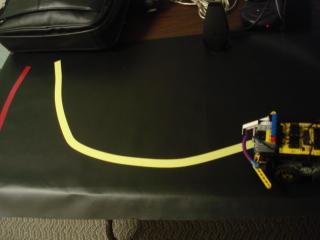
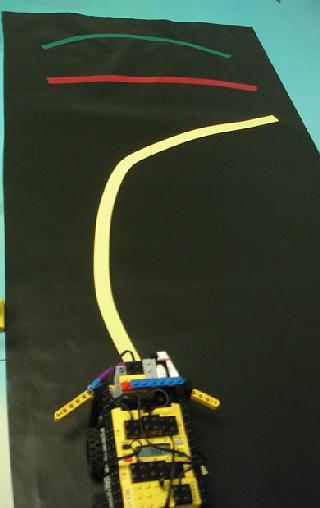
In April the challenge is to get Red Rover and SENSORSCITY to run at the same time.
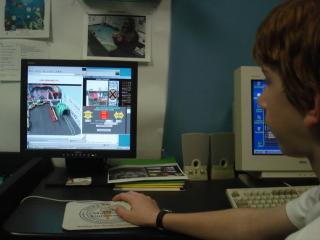
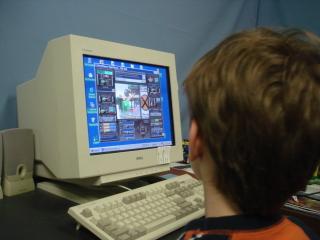
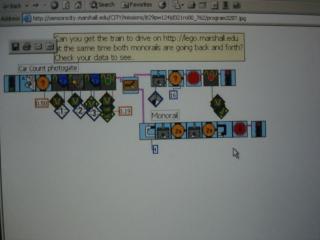
Run http://lego.marshall.edu
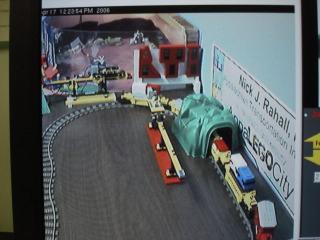
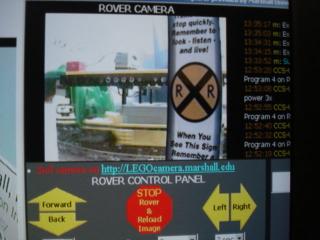
See on http://legocamera.marshall.edu
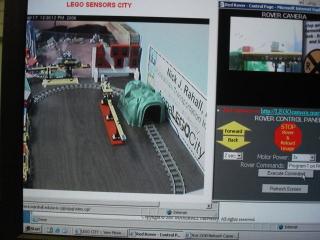
Get data from http://SENSORSCITY.marshall.edu
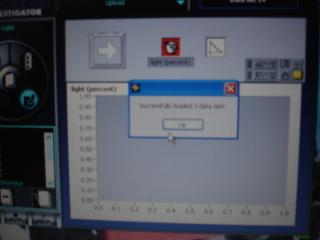
SUCCESS!
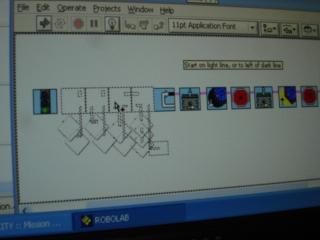
Take the program to a computer with RoboLab
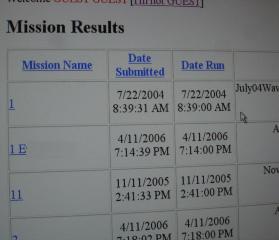
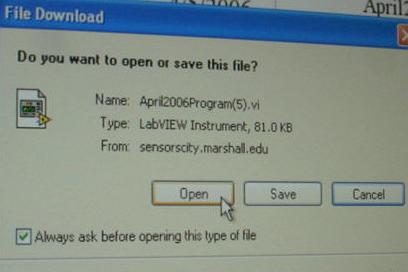
by loading it from you account from SENSORSCITY.
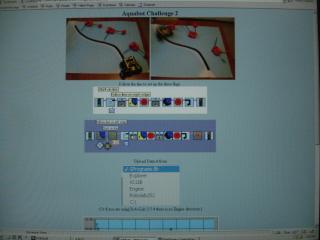
Get a program from http://netapps.marshall.edu/lego/1/3Flags/LineFollow.html or write you own.
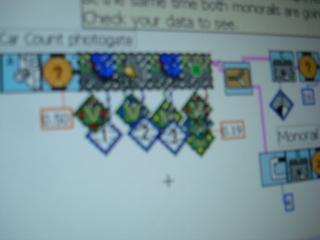
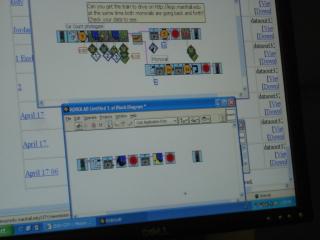
Insert the data logging icons by highlighting them and dragging them from one program to the other.
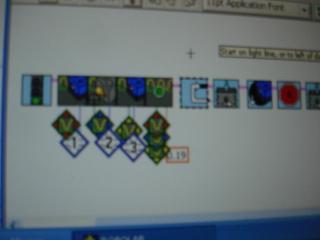
Wire them in by highlighting and holding the next icon and taping the space bar.
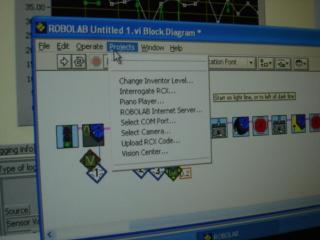
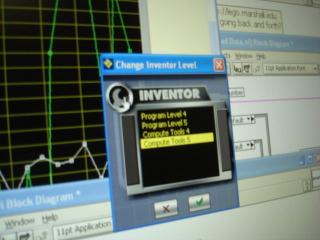
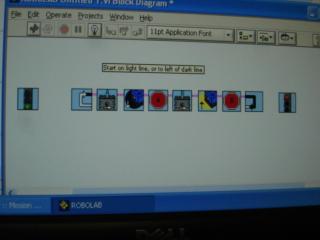
Change to Inventor level Compute Tools 5 by clicking the wrench in the upper left corner of the menu.
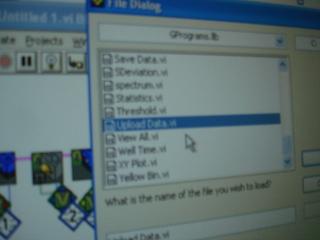
Open Upload Data.vi
The easiest way is to find it in the G-code icons.
I find it will be even easier in RoboLab 2.9.
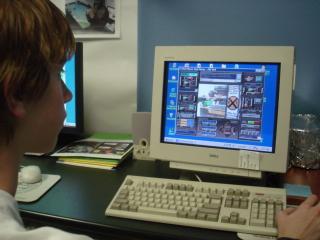
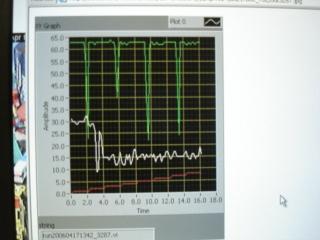
Run the program and upload the data.
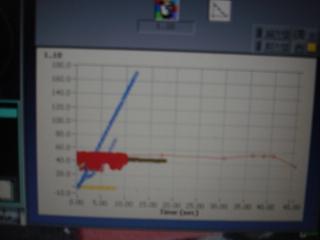
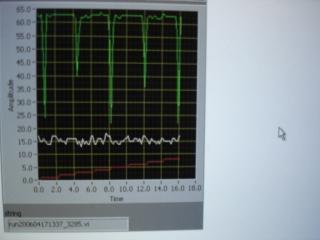
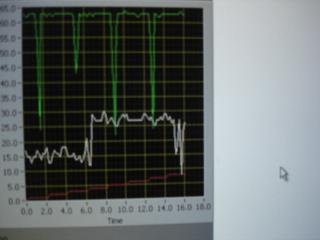
The advantages of using Programmer for 3 sensors at one time instead of Investigator
is that exactly the three graphs are plotted.
On Investigator the 3 are plotted separately and if there are many plots it can be hard to see.
This run through was used in the power point presented April 28 at
Atlanta, Georgia
for the Robotics conference
at FIRST LEGO League Ocean Odyssey World Festival
in conjunction with the FIRST Championship
in Atlanta, Georgia at the Georgia Dome and Georgia World Congress
Center,
April 27 - 29, 2006.