February 9, 2011
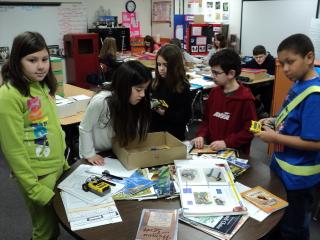
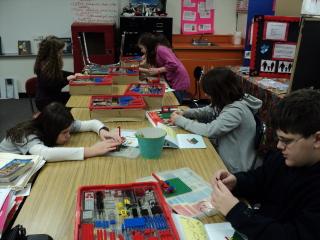
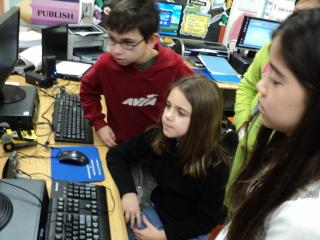
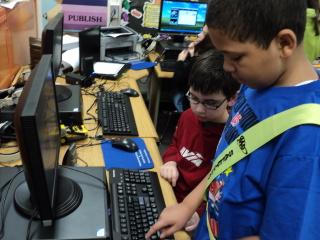
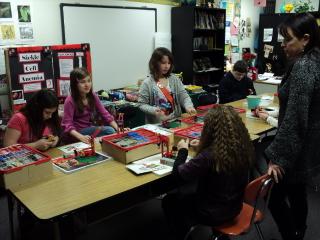
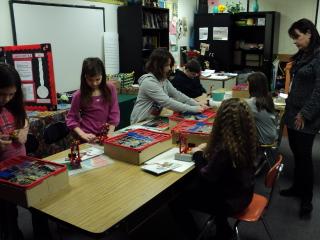
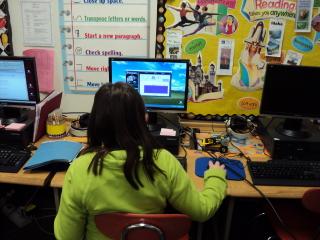
Part of the class is doing datalogging while the rest is making cranes.
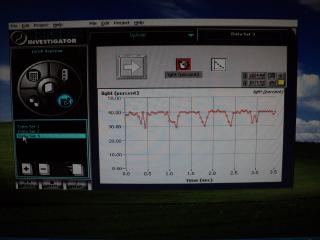
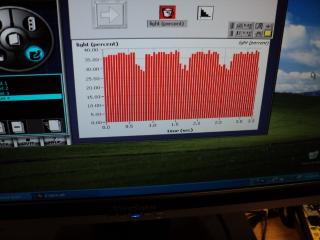
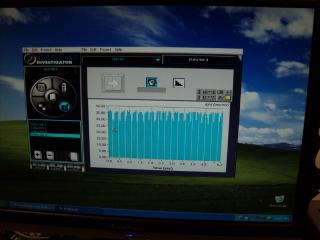
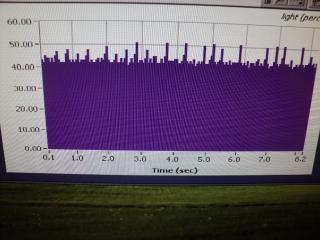
The data from the light sensor can be uploaded to the computer as a line graph
or bar graph.
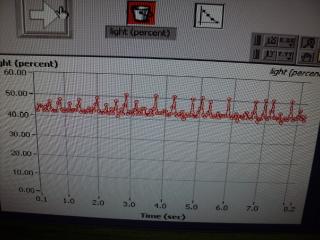
We can see how many time the wheel rotates.
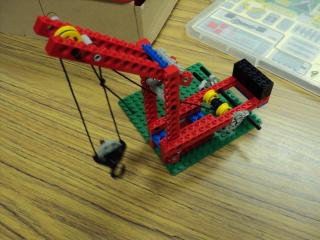
The crane group did great.
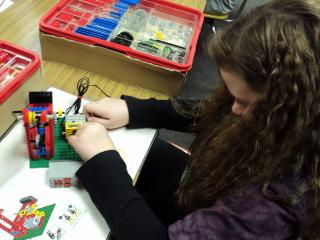
Even motorized.
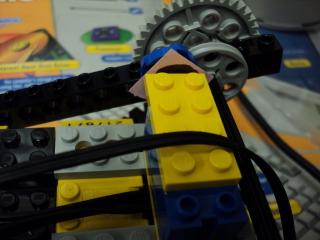
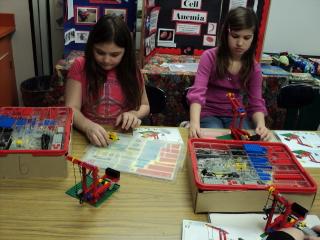
We tried to make a substitution for the black skid but the white shows up better.