February 1, 2012
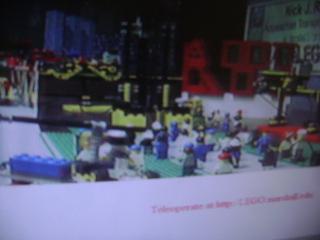
Datalogging can be done over the Internet at http://SENSORSCITY.marshall.edu
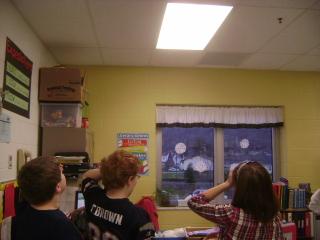
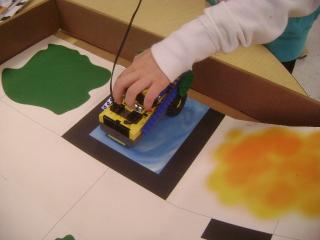
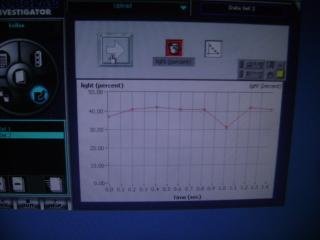
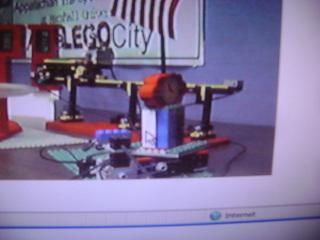
The light sensor takes information on the amount of reflected light.
It "sees" the amount of light sort of like "seeing" your hand in front of your closed eyes
as you wave it in front of your closed eyes.
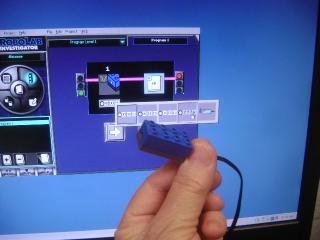
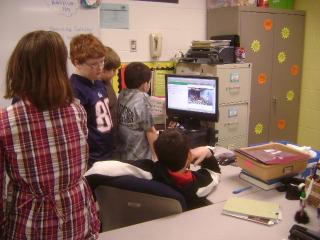
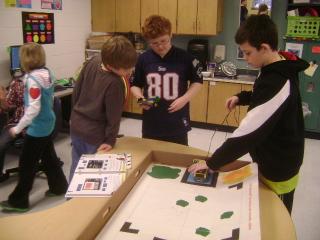
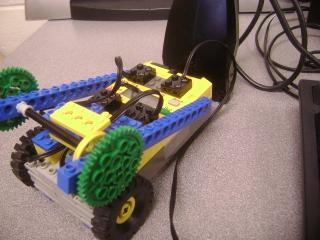
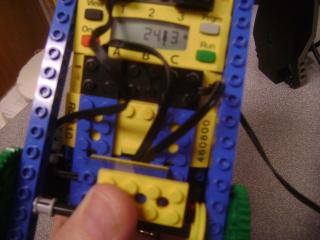
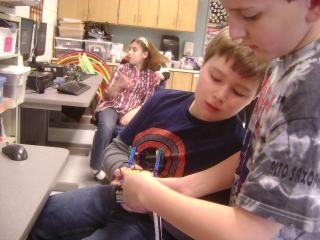
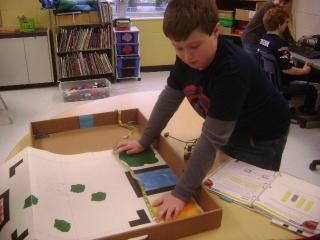
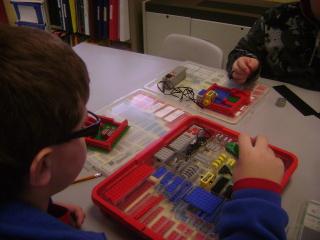
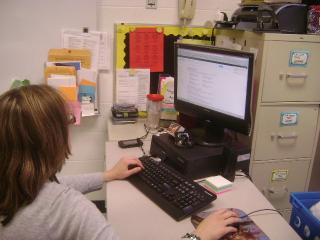
We are going to use a light sensor, write a RoboLab program and upload the data.
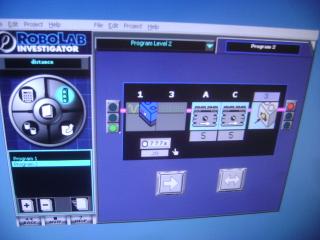
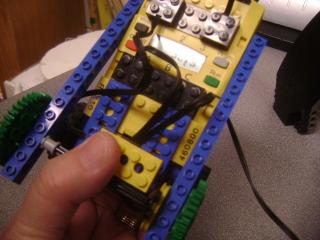
The robot will move and data logged until the touch sensor is pressed.
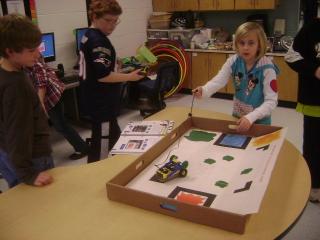
The program is run from one side until the other.
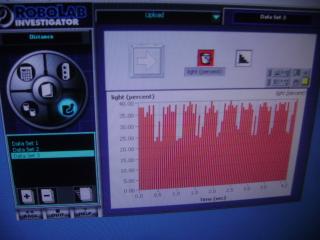
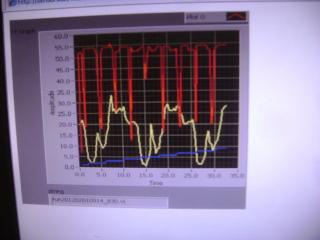
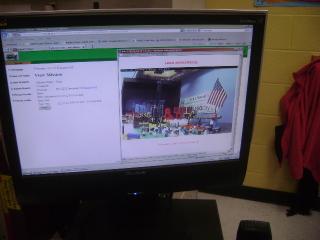
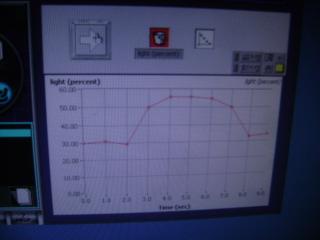
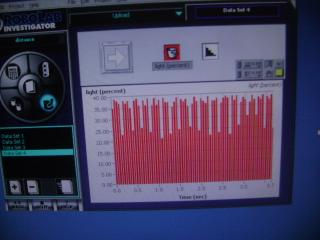
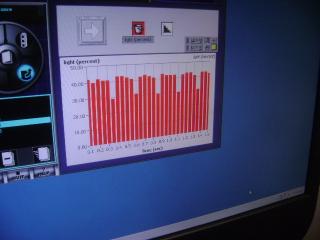
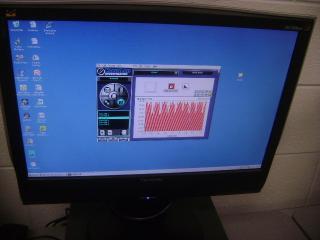
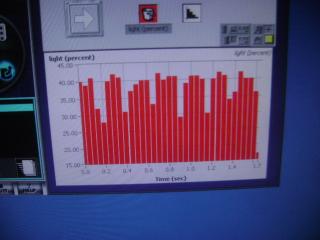
Then the data is up loaded and displayed as a bar graph.
We can count the number of dips.
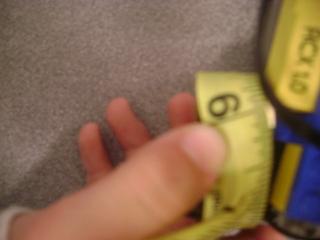
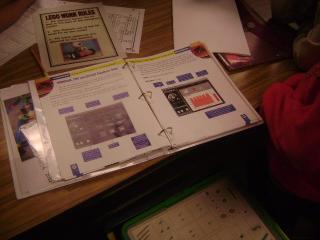
They measured the circumference of the wheel.
Then multiplied that by the number of rotations traveled.
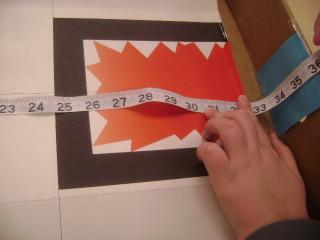
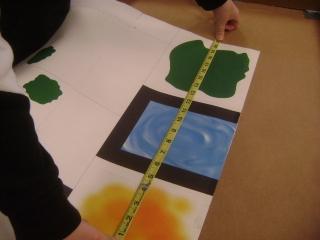
Then they checked their actual distances.
Pretty close.
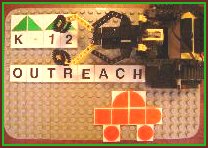
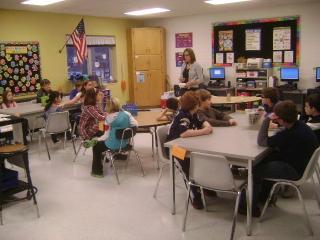
The rest of the class build homes for living in on the new planet.
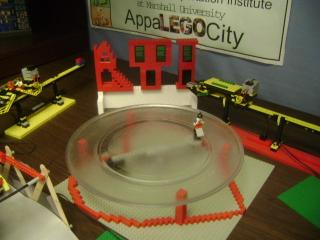
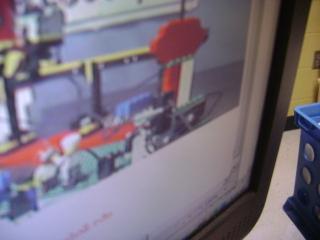
February at LEGO City has a skater on ice above a heart.
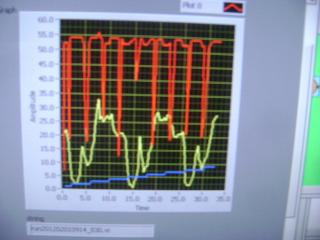
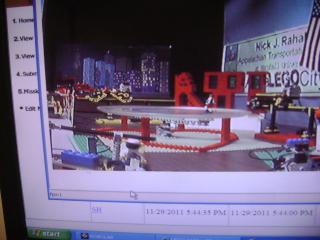
Data from the light sensor facing the flag pole stand is in yellow
in the graph above.
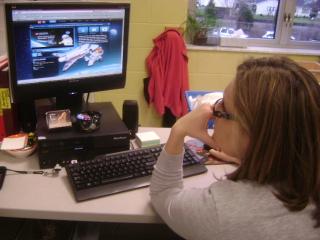
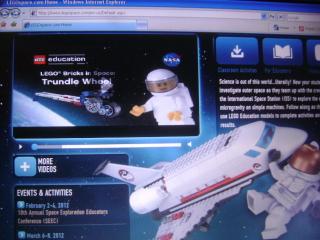
LEGO® Education has partnered with NASA
to create an educational program designed
to inspire the exploration of science, technology, engineering, and
math!
Through the LEGO Bricks in Space program, students work with astronauts
on board the International Space Station (ISS) to conduct activities
that test the effects of microgravity on simple machines.
A total of eight LEGO Education activities will be conducted on the
ISS as astronauts record their results through video and crew commentary.
Each video will then be uploaded to www.LEGOspace.com and will include
a downloadable teacher's guide
and student worksheet so classrooms can complete the same activity
on Earth and compare results with the ISS crew.
The first activity in the series is measuring with trundle.