Measure Bot
March 11, 2003
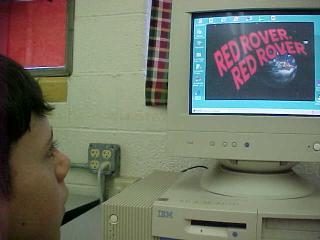
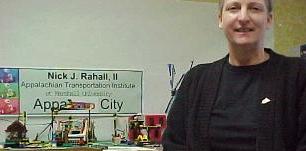
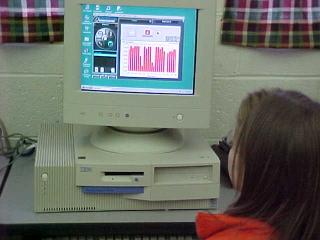
Data from the LEGO city through Red Rover shows up on the buttons.
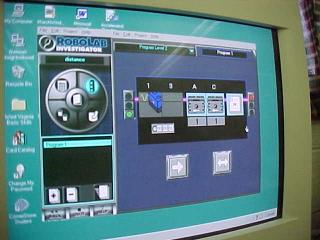
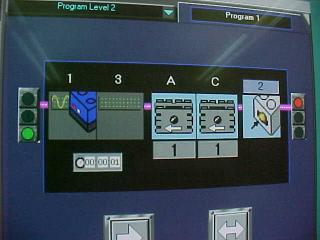
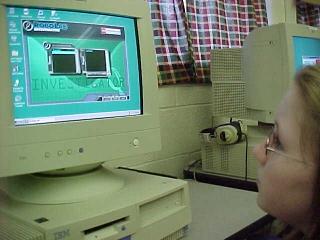
Data logging can be done with RoboLab Investigator.
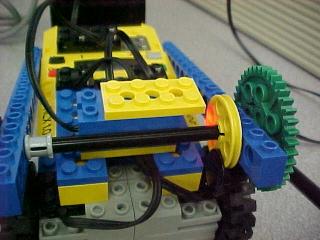
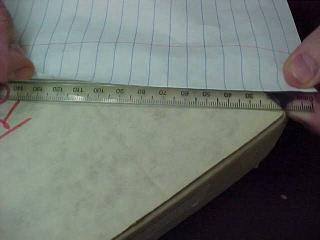
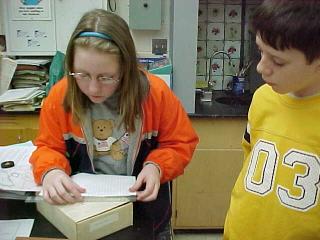
Measure the circumference.
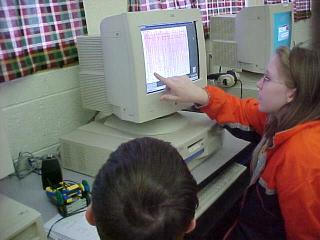
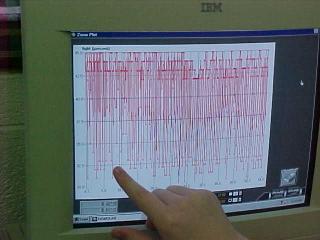
Each time the black spot goes in front of the light sensors the graph
is lower.
We can figure distance.
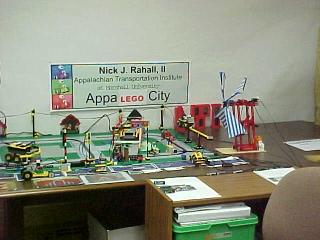
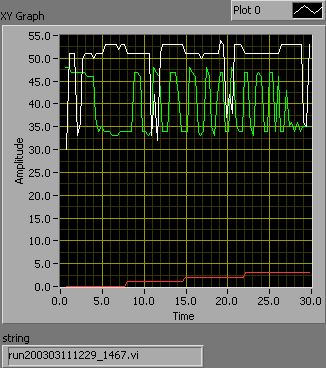
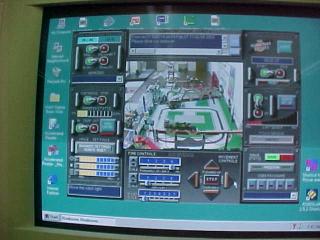
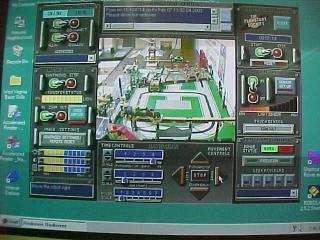
At SENSORSCITY we can use the data to see how many times the car goes
around with the white data,
the number of times the windmill goes around on the green data,
and how many time the monorail goes back and forth on the red data.